Debugging
Django Debug Toolbar
We use the Django Debug Toolbar to debug the CMS in the browser.
When DEBUG is True, i.e. the CMS is run in debugging mode, usually through use of the run.sh script, on every HTML page a sidebar is rendered which contains
additional information about the current request, e.g. code execution times, database queries and profiling info.
When the sidebar is collapsed, you can show it by clicking on the “DJDT” button somewhere along the right edge of the screen:
In order to use this for JSON views, you have to append ?debug to the URL, e.g.:
http://localhost:8000/api/v3/augsburg/de/pages?debug
(See JsonDebugToolbarMiddleware for reference.)
Debugging in various editors and IDEs
For more in depth debugging and integration of the debugging process with your editor or IDE, some setup is likely to be required with said editor. While multiple and often times editor-specific approaches to this exist, we recommend sticking with the Debug Adapter Protocol, or DAP for short. As the name suggests, this is a set of protocols which have implementations both for many editors, and for many languages. DAP functions as an abstraction layer between whatever generic debugging facilities are implemented in the editor, and the actual language-specific debugger. This allows the latter one to be implemented in an entirely editor-agnostic way. For the purposes of the Integreat project, it should also be mentioned that the Python DAP implementation, debugpy, has an option for debugging django applications built-in, significantly reducing the setup effort.
Generally speaking, the steps to setting up a DAP debugger with Integreat look like this:
Install the necessary extensions/plugins/add-ons/…, i.e. the DAP itself,
debugpy, and possibly additional resources like a UI for DAP.Configure the DAP executable or server, telling DAP what program will do the actual debugging. In our case, this is
debugpy.Add a so-called DAP configuration. This tells DAP how to interact with our project.
It is DAP’s task to connect these two parts of the puzzle.
Below, you can find more specific instructions for configuring your preferred editor or IDE.
Note that debugpy itself is included in the dev dependencies in our pyproject.toml, so you do not have to install it separately.
VSCode/VSCodium
The VSCode Python Extension should automaticly contain the Python Debugger Extension. You can check and install it via the Extensions view.
In your .vscode/launch.json two Debugging modes are defined: With or without Docker.
You might need to change the "program" variable to your local location of the integreat_cms/ folder. With the "env" variable, you can set environment variables with settings for the CMS like "INTERGREAT_CMS_DEBUG". For more options, check the VSCode documentation <https://code.visualstudio.com/docs/python/debugging>
When you go to Run and Debug, select Python Debugger: Django (with Docker) or Python Debugger: Django (without Docker) from the drop-down and hit Start Debugging.
The local server should start and you should be able to use the CMS like after running run.sh.
For VSCodium it should work the same as long as you use the official Python Extension, though I never tested this at this point (8th May 2025).
PyCharm (Professional)
PyCharm Professional has built-in support for django projects, but it needs some configuration to work with the integreat CMS. This is unfortunately not the case for the free edition of PyCharm. Students can get a free license for the professional version, however.
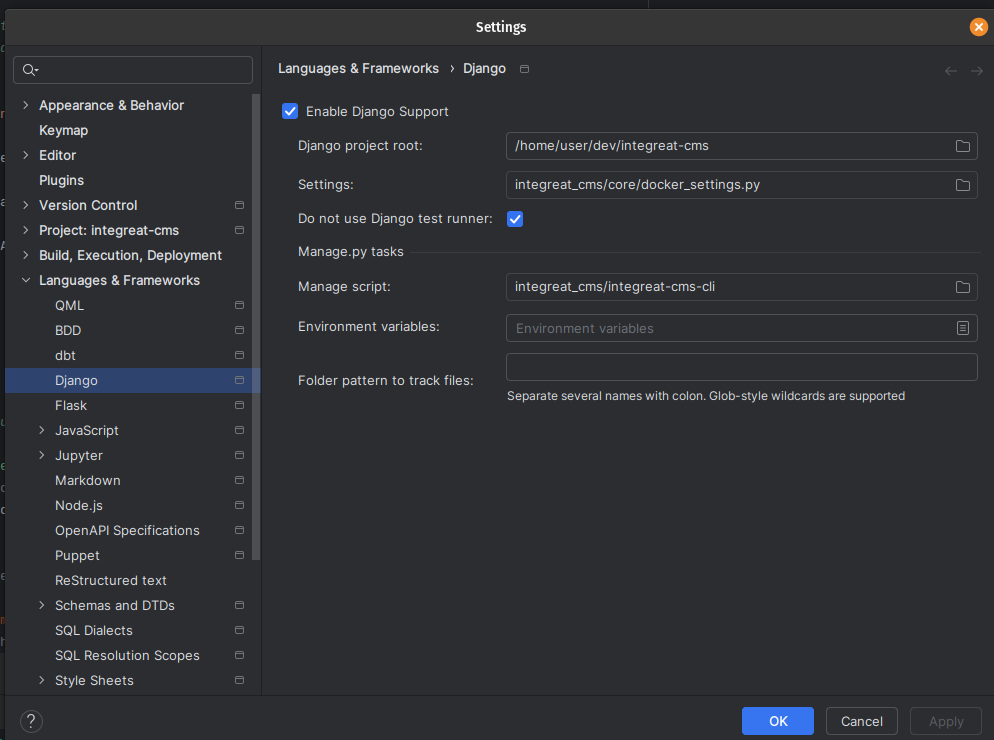
Enable Django Support
Go to settings → Languages & Frameworks → Django
Click the
Enable Django SupportCheckboxSet the root
integreat_cmsdirectory as the project rootFor
Settingsuseintegreat_cms/core/docker_settings.pyCheck
Do not use Django test runnerFor
Manage script, useintegreat_cms/integreat-cms-cli. If PyCharm does not let you select this script, because it does not end in .py, you can manually specify it in.idea/integreat-cms.iml.
Your configuration should now look similar to this:
Create a Run Configuration
Create a new
Django Serverrun configurationUse a different port (For example 8001) to avoid conflicts with the non-debug server at port 8000
At Environment Variables, add these:
PYTHONUNBUFFERED=1;DJANGO_SETTINGS_MODULE=integreat_cms.core.docker_settings;INTEGREAT_CMS_DEBUG=True
Start Debugging
First execute the
./tools/run.shto make sure that the database is available and all assets are compiled.Once the server has started, you can start debugging by launching the run configuration
Neovim
Neovim enjoys excellent DAP support through the nvim-dap plugin.
Further, there also exists nvim-dap-python, which handles step two of the three steps listed above, taking care of configuring the integration with debugpy.
The following instructions assume that you are using lazy.nvim as your neovim plugin manager. They are easily adaptable for different plugin managers though, with all the linked projects providing instructions for multiple different plugin managers.
DAP & DAP-UI
Add nvim-dap to your installed plugins:
"mfussenegger/nvim-dap",
It is also highly recommended to install nvim-dap-ui alongside it, since DAP does not come with a UI of its own:
{
       "rcarriga/nvim-dap-ui",
       dependencies = {
               "mfussenegger/nvim-dap",
               "nvim-neotest/nvim-nio",
       },
 }
Optionally, you can also install nvim-dap-virtual-text, which will place variable values next the variable definitions as virtual text (see the usage section for how this looks):
"theHamsta/nvim-dap-virtual-text",
All of these plugins come with their own set of configuration options, mostly concerned with key binds and visual changes. Check their respective README file for more.
Configure debugpy
While you can do this manually as well, there is virtually no benefit to handling this manually compared to using nvim-dap-python.
First, add the plugin:
"mfussenegger/nvim-dap-python",
Then initialize the plugin from anywhere in your neovim config:
require("dap-python").setup("python")
Note that this expects python to be a valid command, and to point to the correct python version.
Most likely, this is the case already. You can check this by running which python when inside the Integreat project and having the Python virtual environment active.
It should return /home/<your-user>/<...>/integreat-cms/.venv/bin/python.
If this is not the case for you, you can also pass an absolute path to the setup() function, although this means that your DAP setup is less flexible, since it is then bound to the Integreat project’s Python installation explicitly.
Configure the integration with Django
The config below contains comments which can hopefully help you customize these settings, if so desired:
table.insert(require('dap').configurations.python, {
   name = 'Launch Django DAP',                            -- you can freely change this
   type = 'python',                                       -- this must be "python". Will not work otherwise
   request = 'launch',                                    -- either "launch" a new debugging session, or "attach" to one you've started yourself. Recommended to leave as "launch"
   program = vim.loop.cwd() .. "/.venv/bin/django-admin", -- see explanation below
   args = { "runserver", "--noreload" },                  -- also see explanation below
   console = "integratedTerminal",                        -- can also be "internalConsole" or "externalTerminal", but this works best with nvim-dap-ui
   django = true,                                         -- probably obvious :)
   justMyCode = true,                                     -- will only debug our own code. Set to "false" in order to also debug python standard libraries etc
   env = {                                                -- required environment variables
     DJANGO_SETTINGS_MODULE = "integreat_cms.core.settings",
     INTEGREAT_CMS_DEBUG = "true",
     INTEGREAT_CMS_SECRET_KEY = "dummy",
   },
 })
Two options need special highlighting. program points to the script that should be run in order to start the CMS.
You might have expected this to be ./tools/integreat-cms-cli or similar, but debugpy expects this to be a Python file.
As an alternative, you can swap vim.loop.cwd() .. "/.venv/bin/django-admin" out with vim.loop.cwd() .. "/.venv/bin/integreat-cms-cli".
These should work the same, but in case you are working with Django projects beyond Integreat (like Lunes or the Compass), django-admin would make the config work with all of those projects.
Second, the arguments passed in the args option are mandatory. You can add more (see the documentation for debugpy), but without these, debugging will not work.
Set up key binds (optional)
These are up to you. You could, for example, use:
{
    action = "<cmd>lua require('dap').set_breakpoint(vim.fn.input('Breakpoint condition: '))<cr>",
    key = "<leader>dB",
    mode = "n",
    options = { desc = "Breakpoint Condition", silent = true },
},
{
    action = "<cmd>DapToggleBreakpoint<cr>",
    key = "<leader>db",
    mode = "n",
    options = { desc = "Toggle Breakpoint", silent = true },
},
{
    action = "<cmd>DapContinue<cr>",
    key = "<leader>dr",
    mode = "n",
    options = { desc = "Start or Continue", silent = true },
},
{
    action = "<cmd>lua require('dapui').toggle()<cr>",
    key = "<leader>du",
    mode = "n",
    options = { desc = "Dap UI", silent = true },
},
Usage example: PageFormView
We will round off the debugger setup for neovim with a practical example.
Let’s say we suspect a bug somewhere in the get method of the PageFormView.
Then the debugging workflow might look something like this:
Ensure the CMS is not running. The debugger will start it on its own, and an already-running CMS will block the required ports. However, if you have just run
./tools/prune_database.sh, be sure to run./tools/loadtestdata.shbefore starting the debugger: this is usually handled by./tools/run.sh, but since the debugger does not use this script, it has no way of populating the database on its own!Start the debugger using the configured key bind or the
DapContinuecommand. You will be presented with multiple options on which debugger configuration to start - select the one you have created (named “Launch Django DAP” in the example configuration above) and press enter.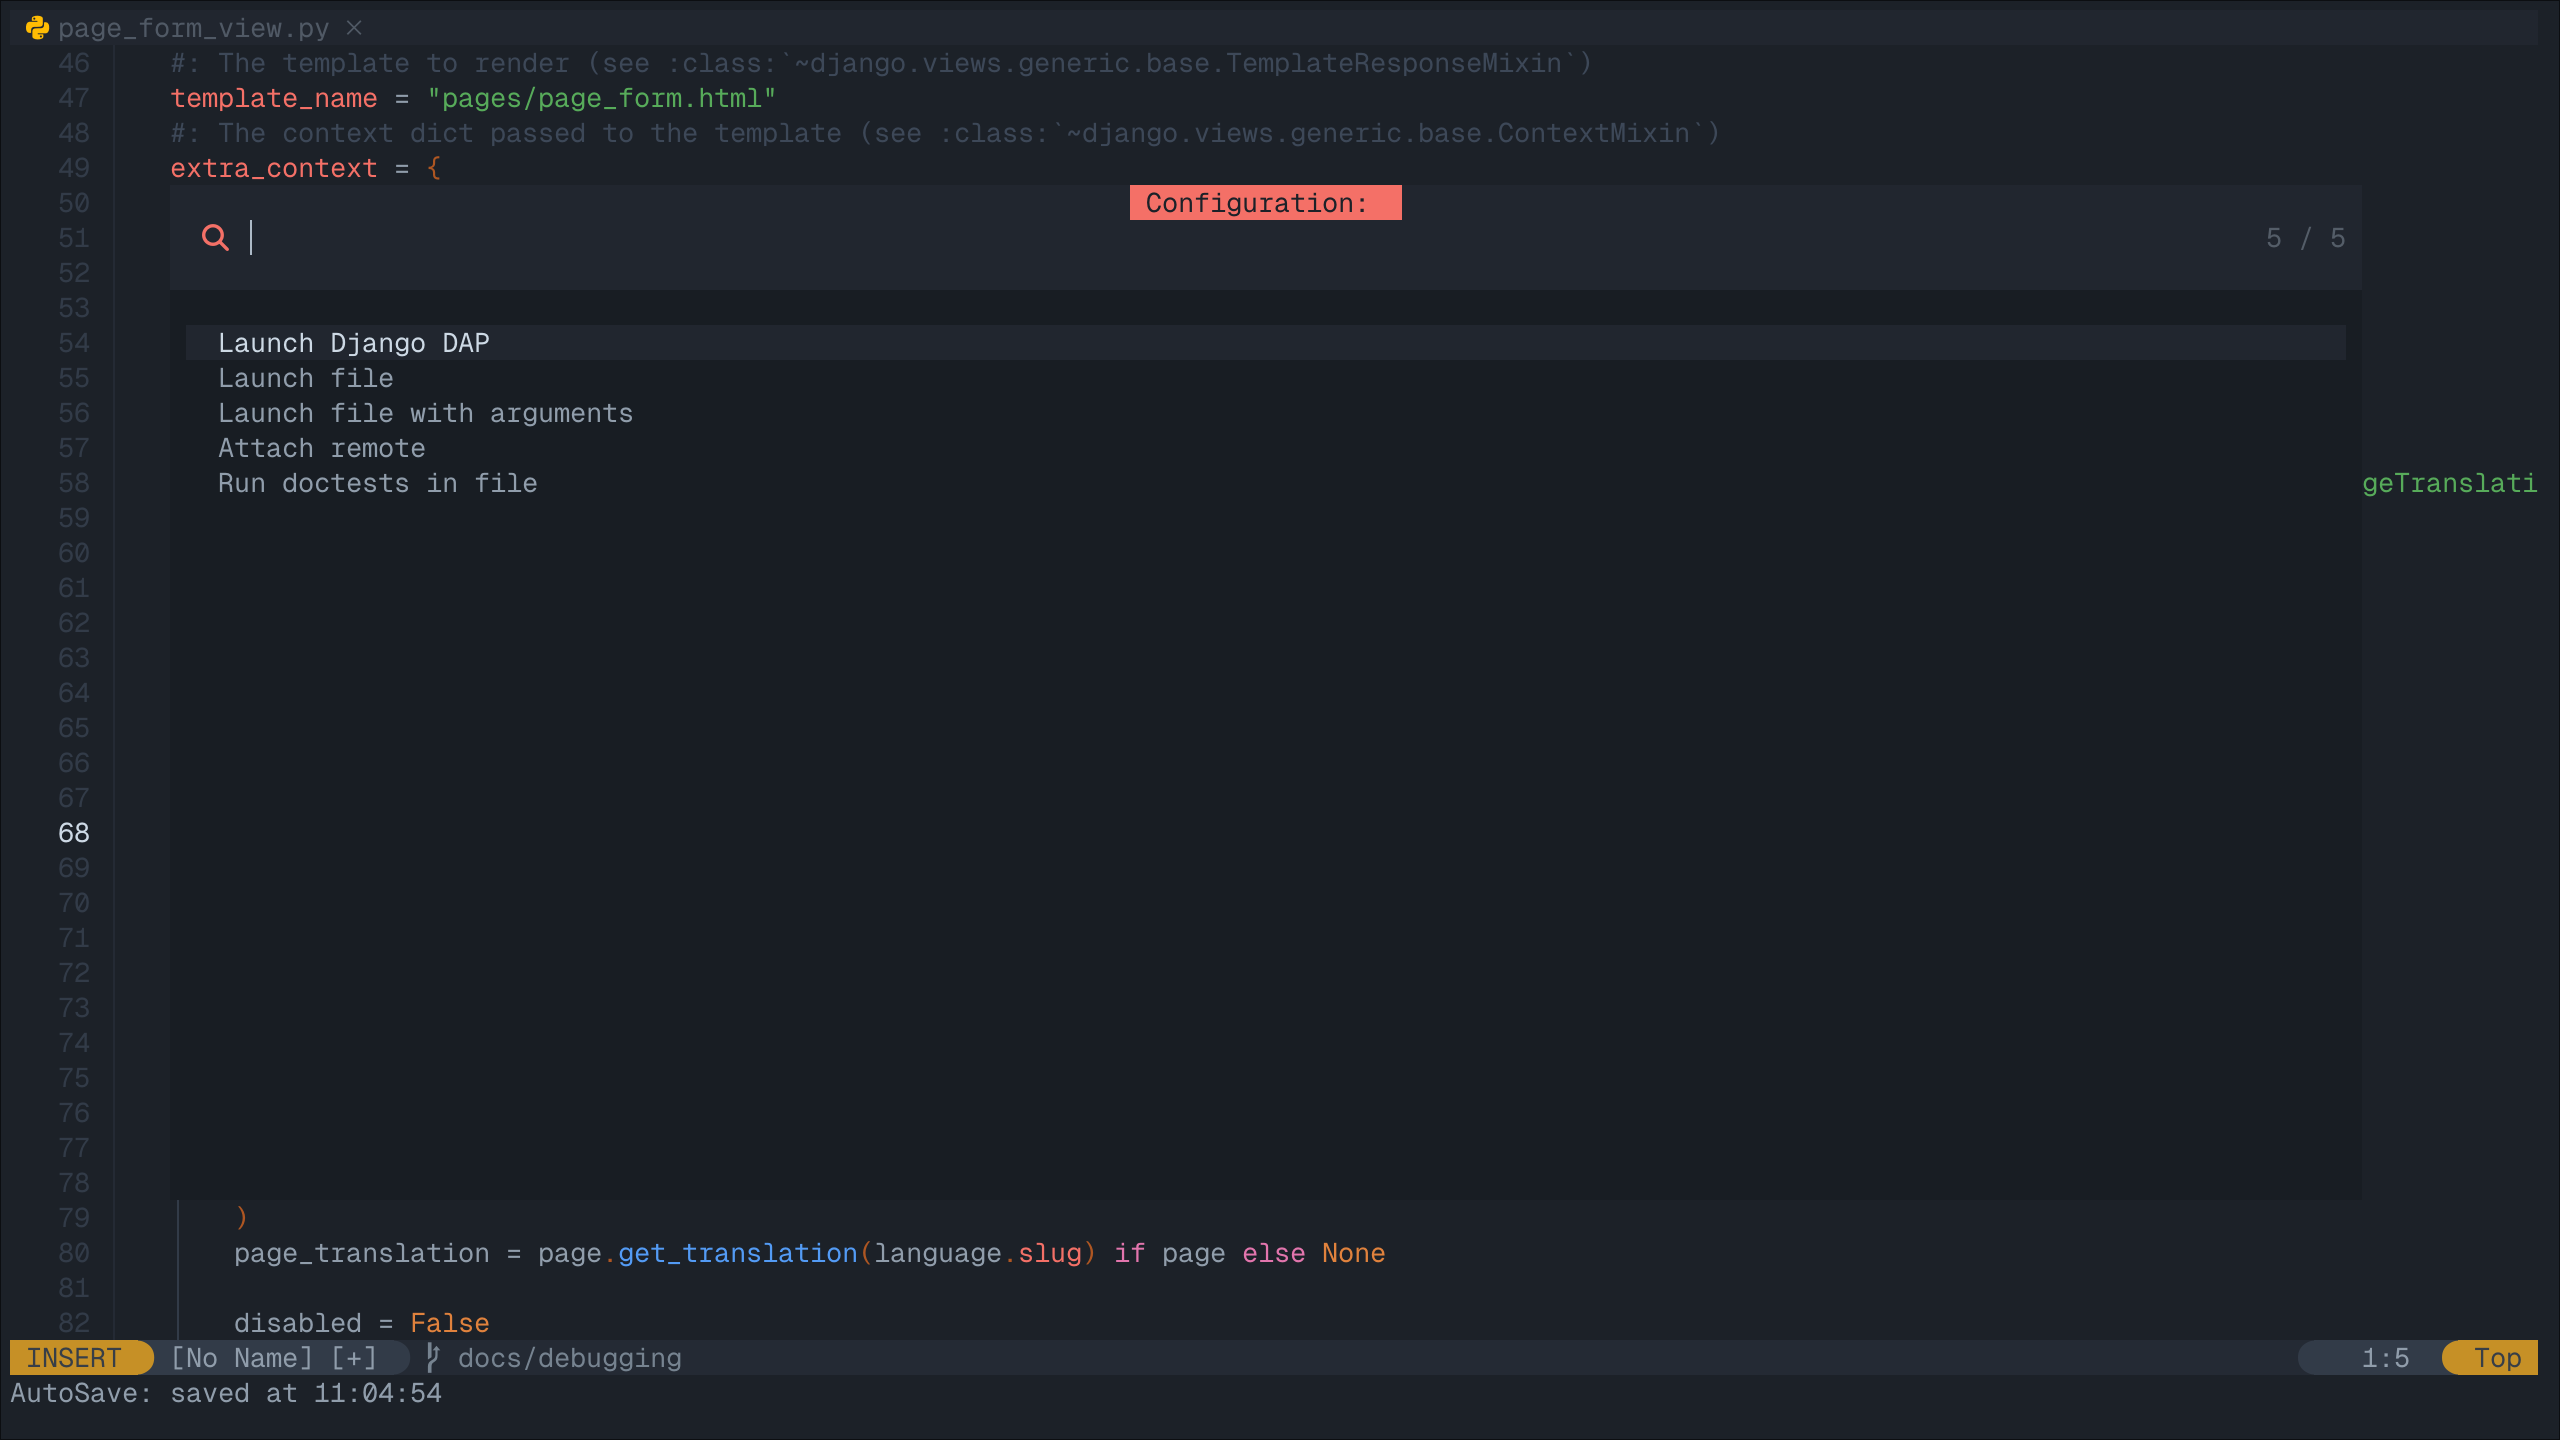
nvim-dap-uiwill open and look something like this: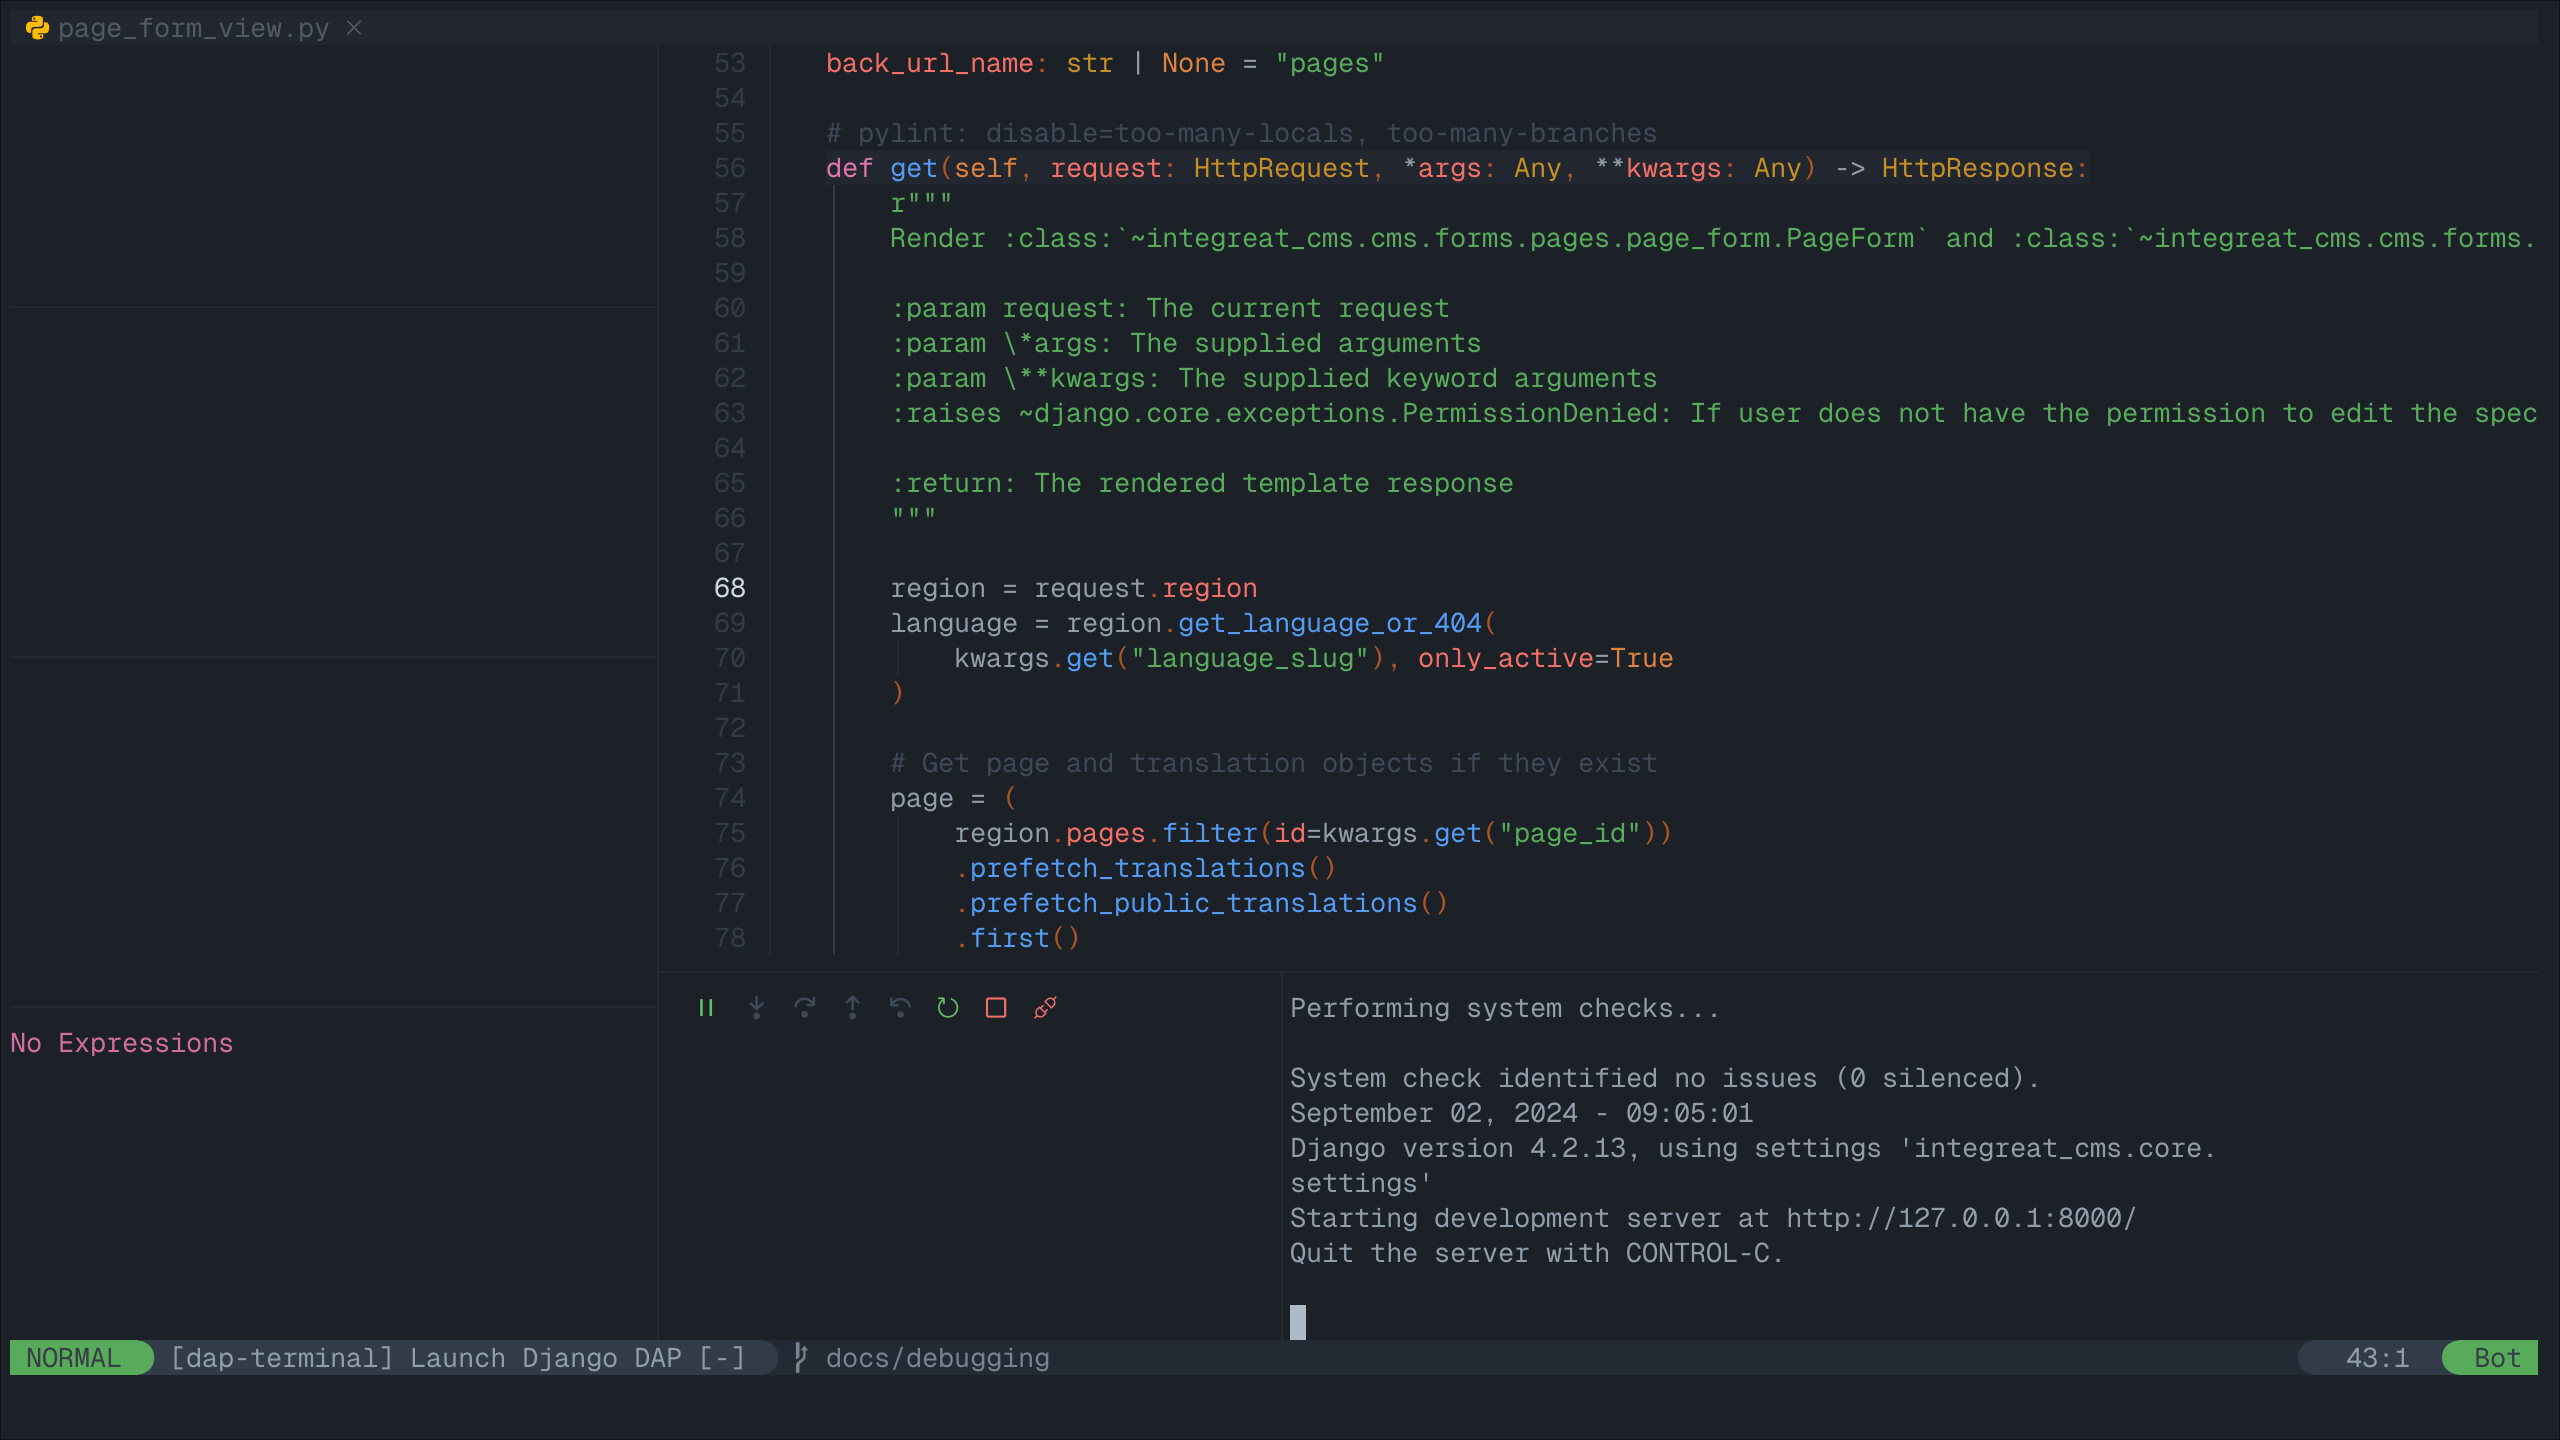
In the bottom right, you can see the usual console output you get when running the Integreat CMS.
To the left of it, a number of controls are shown. From left to right these are used to:
Pause/resume the debugger;
Step into: move the debugger pointer into a function call, or to the next statement;
Step over: move the debugger pointer over a function call, to the next statement;
Step out: finish the execution of the current function, then move the debugger pointer back into the calling function;
Step backwards: usually not possible with python code, as the state of the program cannot be reverted;
Restart the debugger;
Stop the debugger;
Disconnect the debugger, but leave the debugging process running.
The top box on the left is currently empty. It will later be filled with all in-scope variables and their current values.
The second box on the left is also empty. It will list all currently set breakpoints.
The third box on the left is also empty. It will list currently existing processes.
The bottom box on the left allows you to write custom (python) expressions and to see their value. This is an extremely powerful feature. Simply enter insert mode, type the python expression, and press enter. For more, see this section in the docs.
Navigate to the
getmethod and place your cursor at the first line of interest within it. Use the “toggle breakpoint” key bind or theDapToggleBreakpointcommand to set a breakpoint. The breakpoint appears in the second box on the left.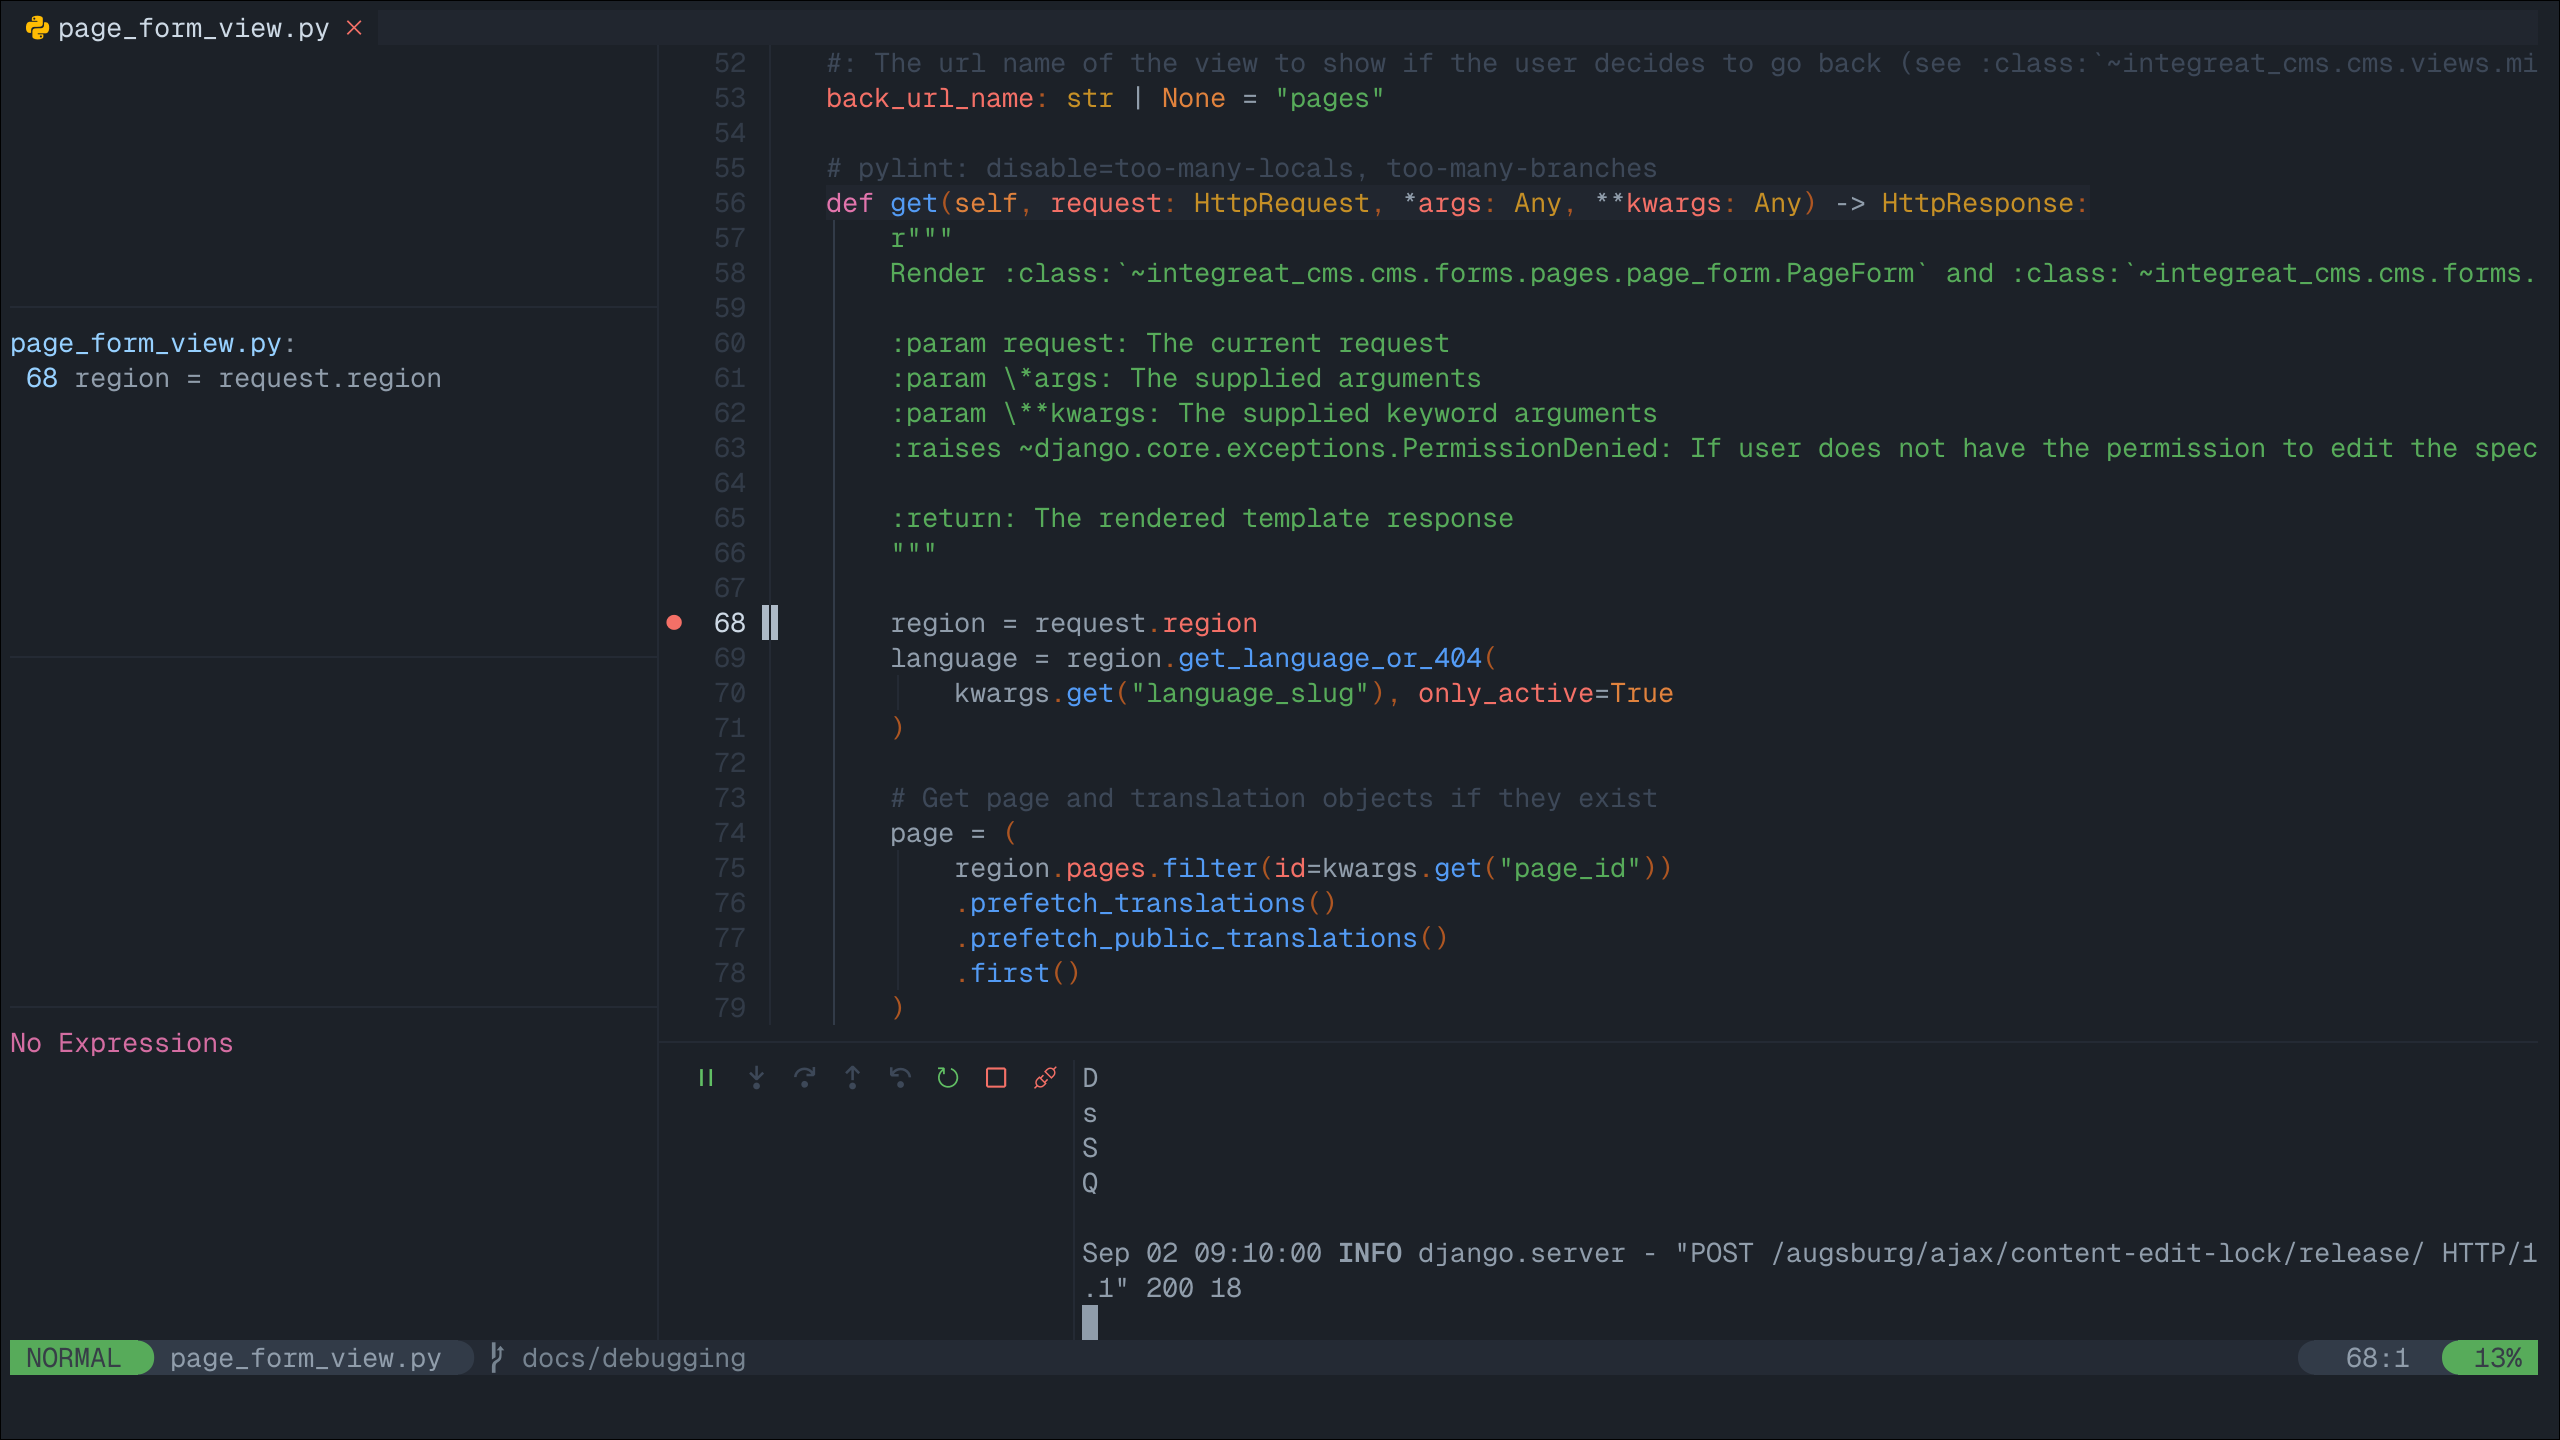
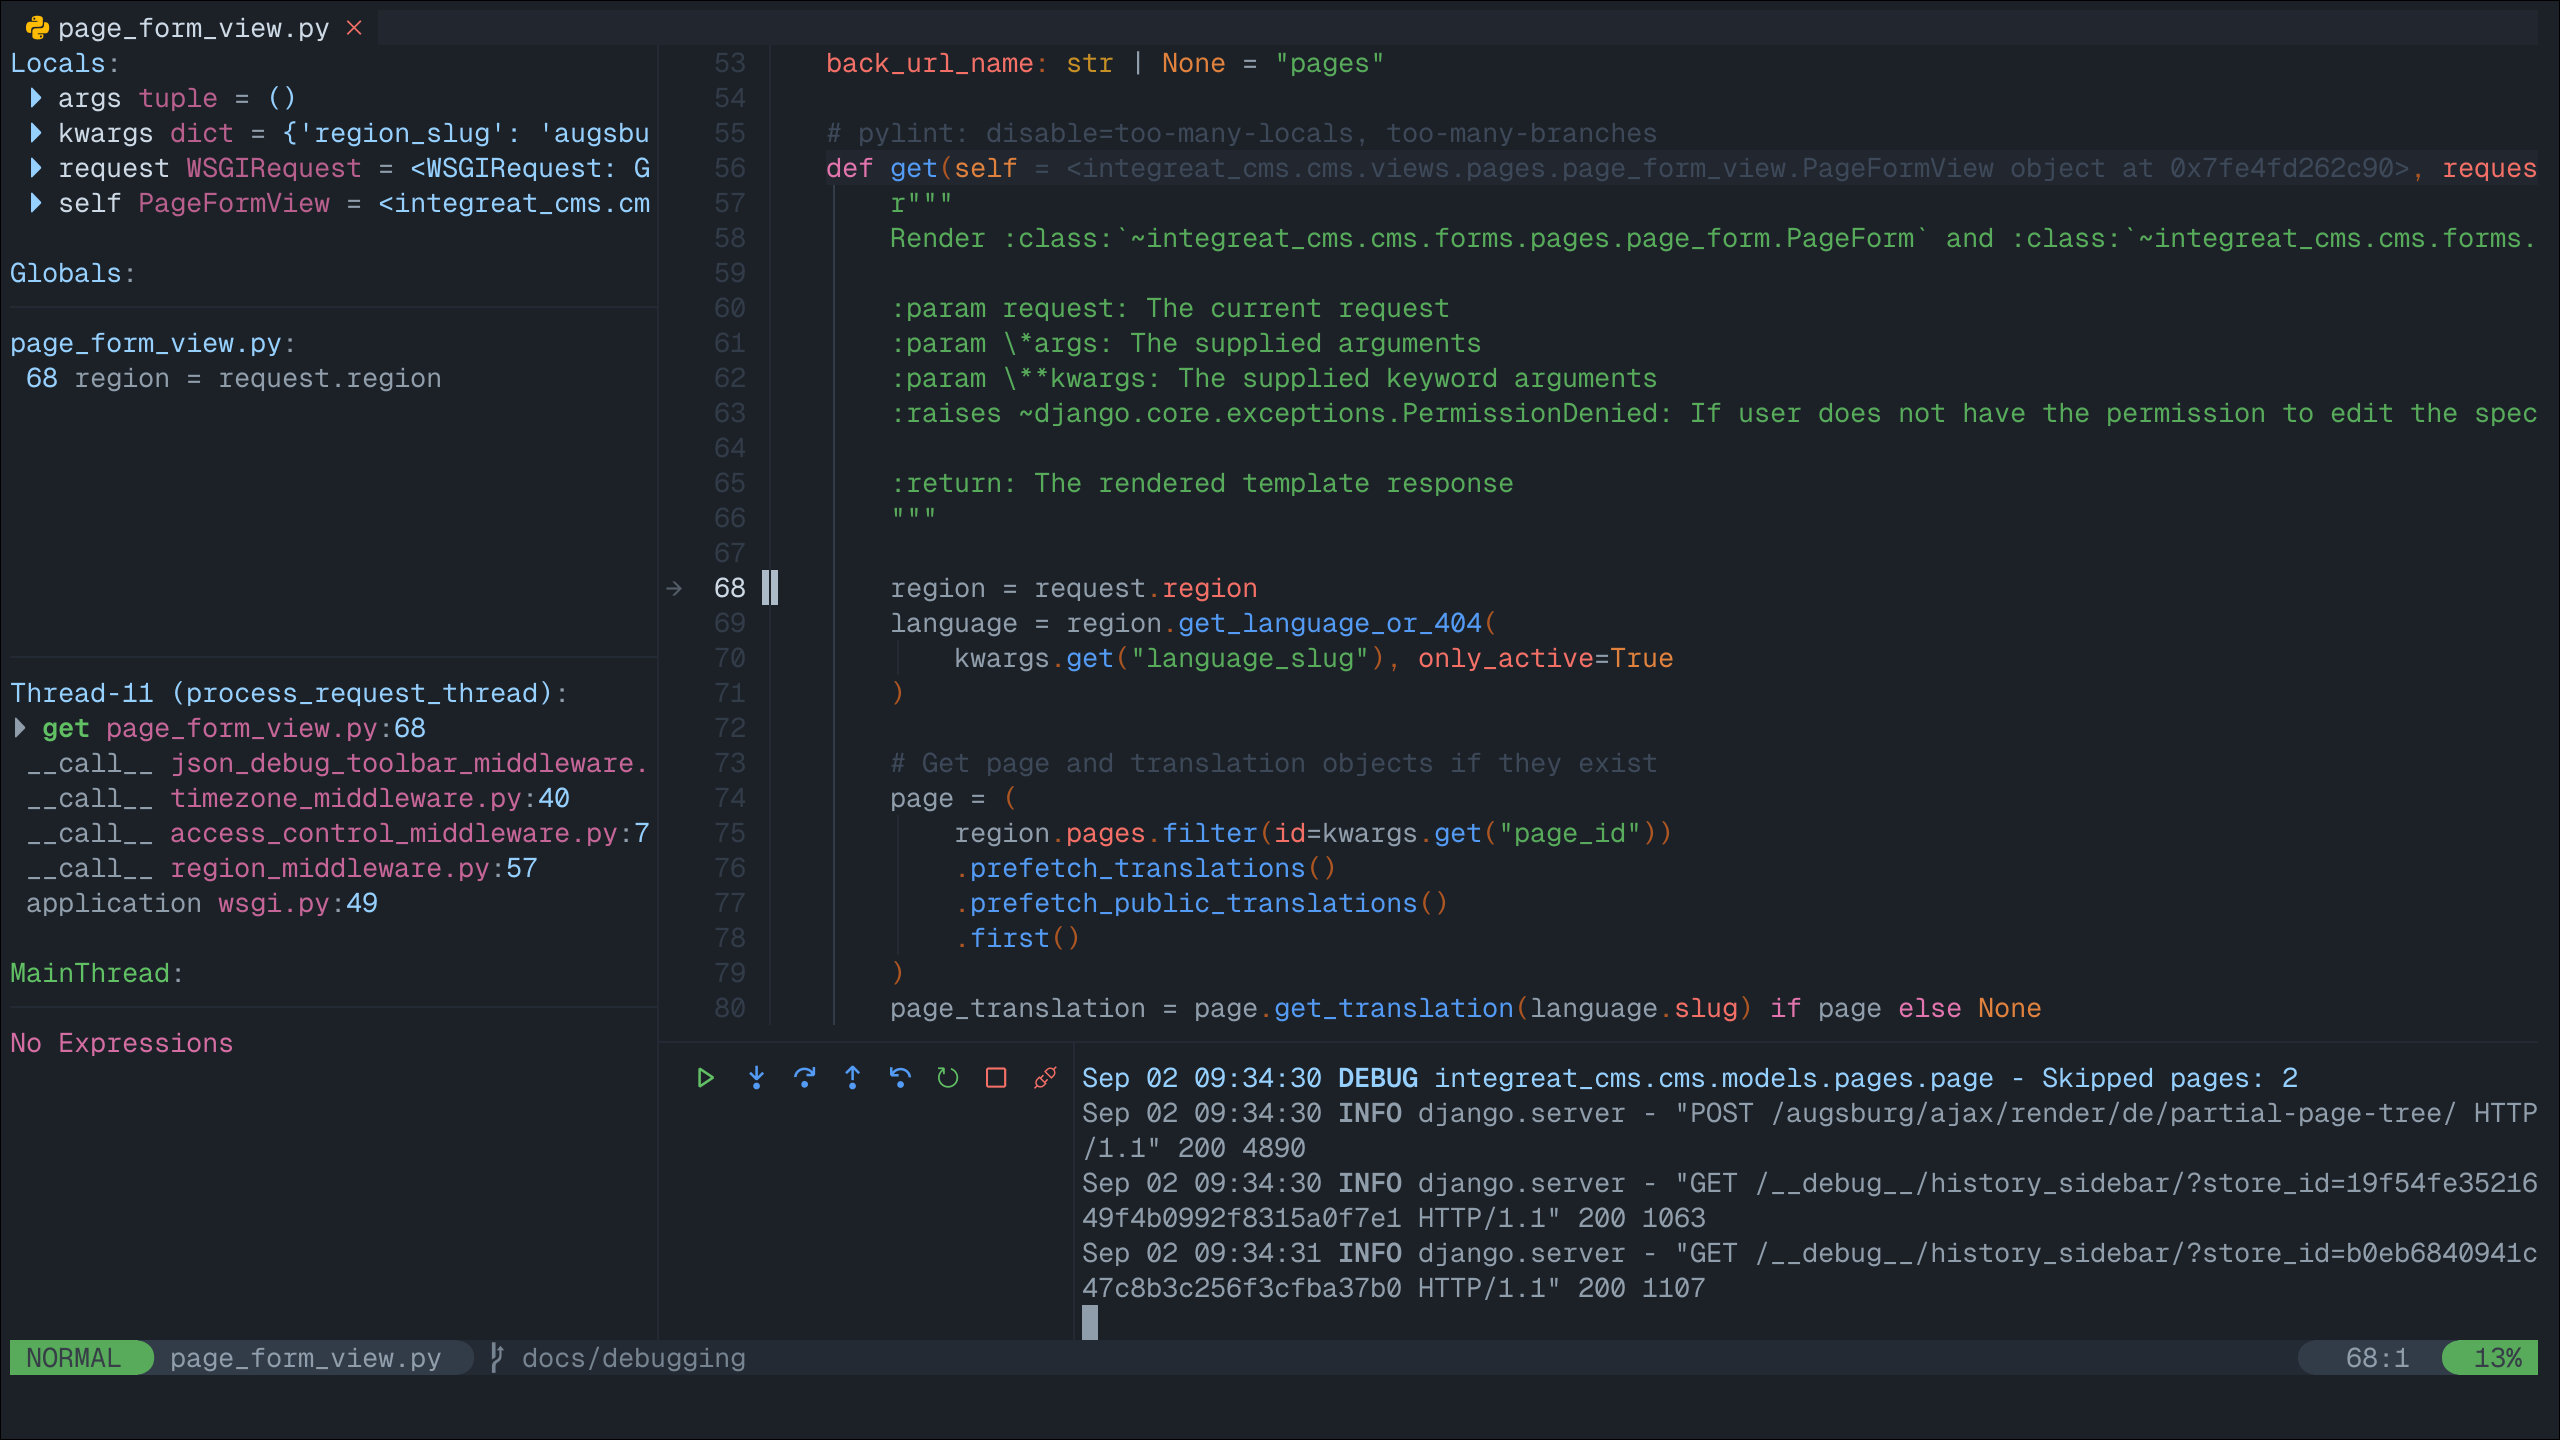
In your browser, navigate to any page form view, for example: “Willkommen” in “Stadt Augsburg”. Note that your browser will appear to be stuck in the page list view, unable to finish loading the page form view - this is intentional! The red breakpoint indicator has changed to a gray arrow, indicating the line the debugger is currently stopped at. The information in the boxes on the left have changed to reflect the program state at this line. You can navigate through the boxes with your usual key binds and extend the variable definitions to see their current values.
Pressing the (now no longer grayed-out) “step over” button, the cursor will move one line down. At the same time, the variable
regionand its value is added to the “Locals” section in the top-left box, since it has been created in the execution step we just performed. If you did install thenvim-dap-virtual-textplugin, variable values will also be placed next to that variable’s definition in the code, where it will be updated when the value changes. This can be a more intuitive visualization than using the variable box in the top-left corner.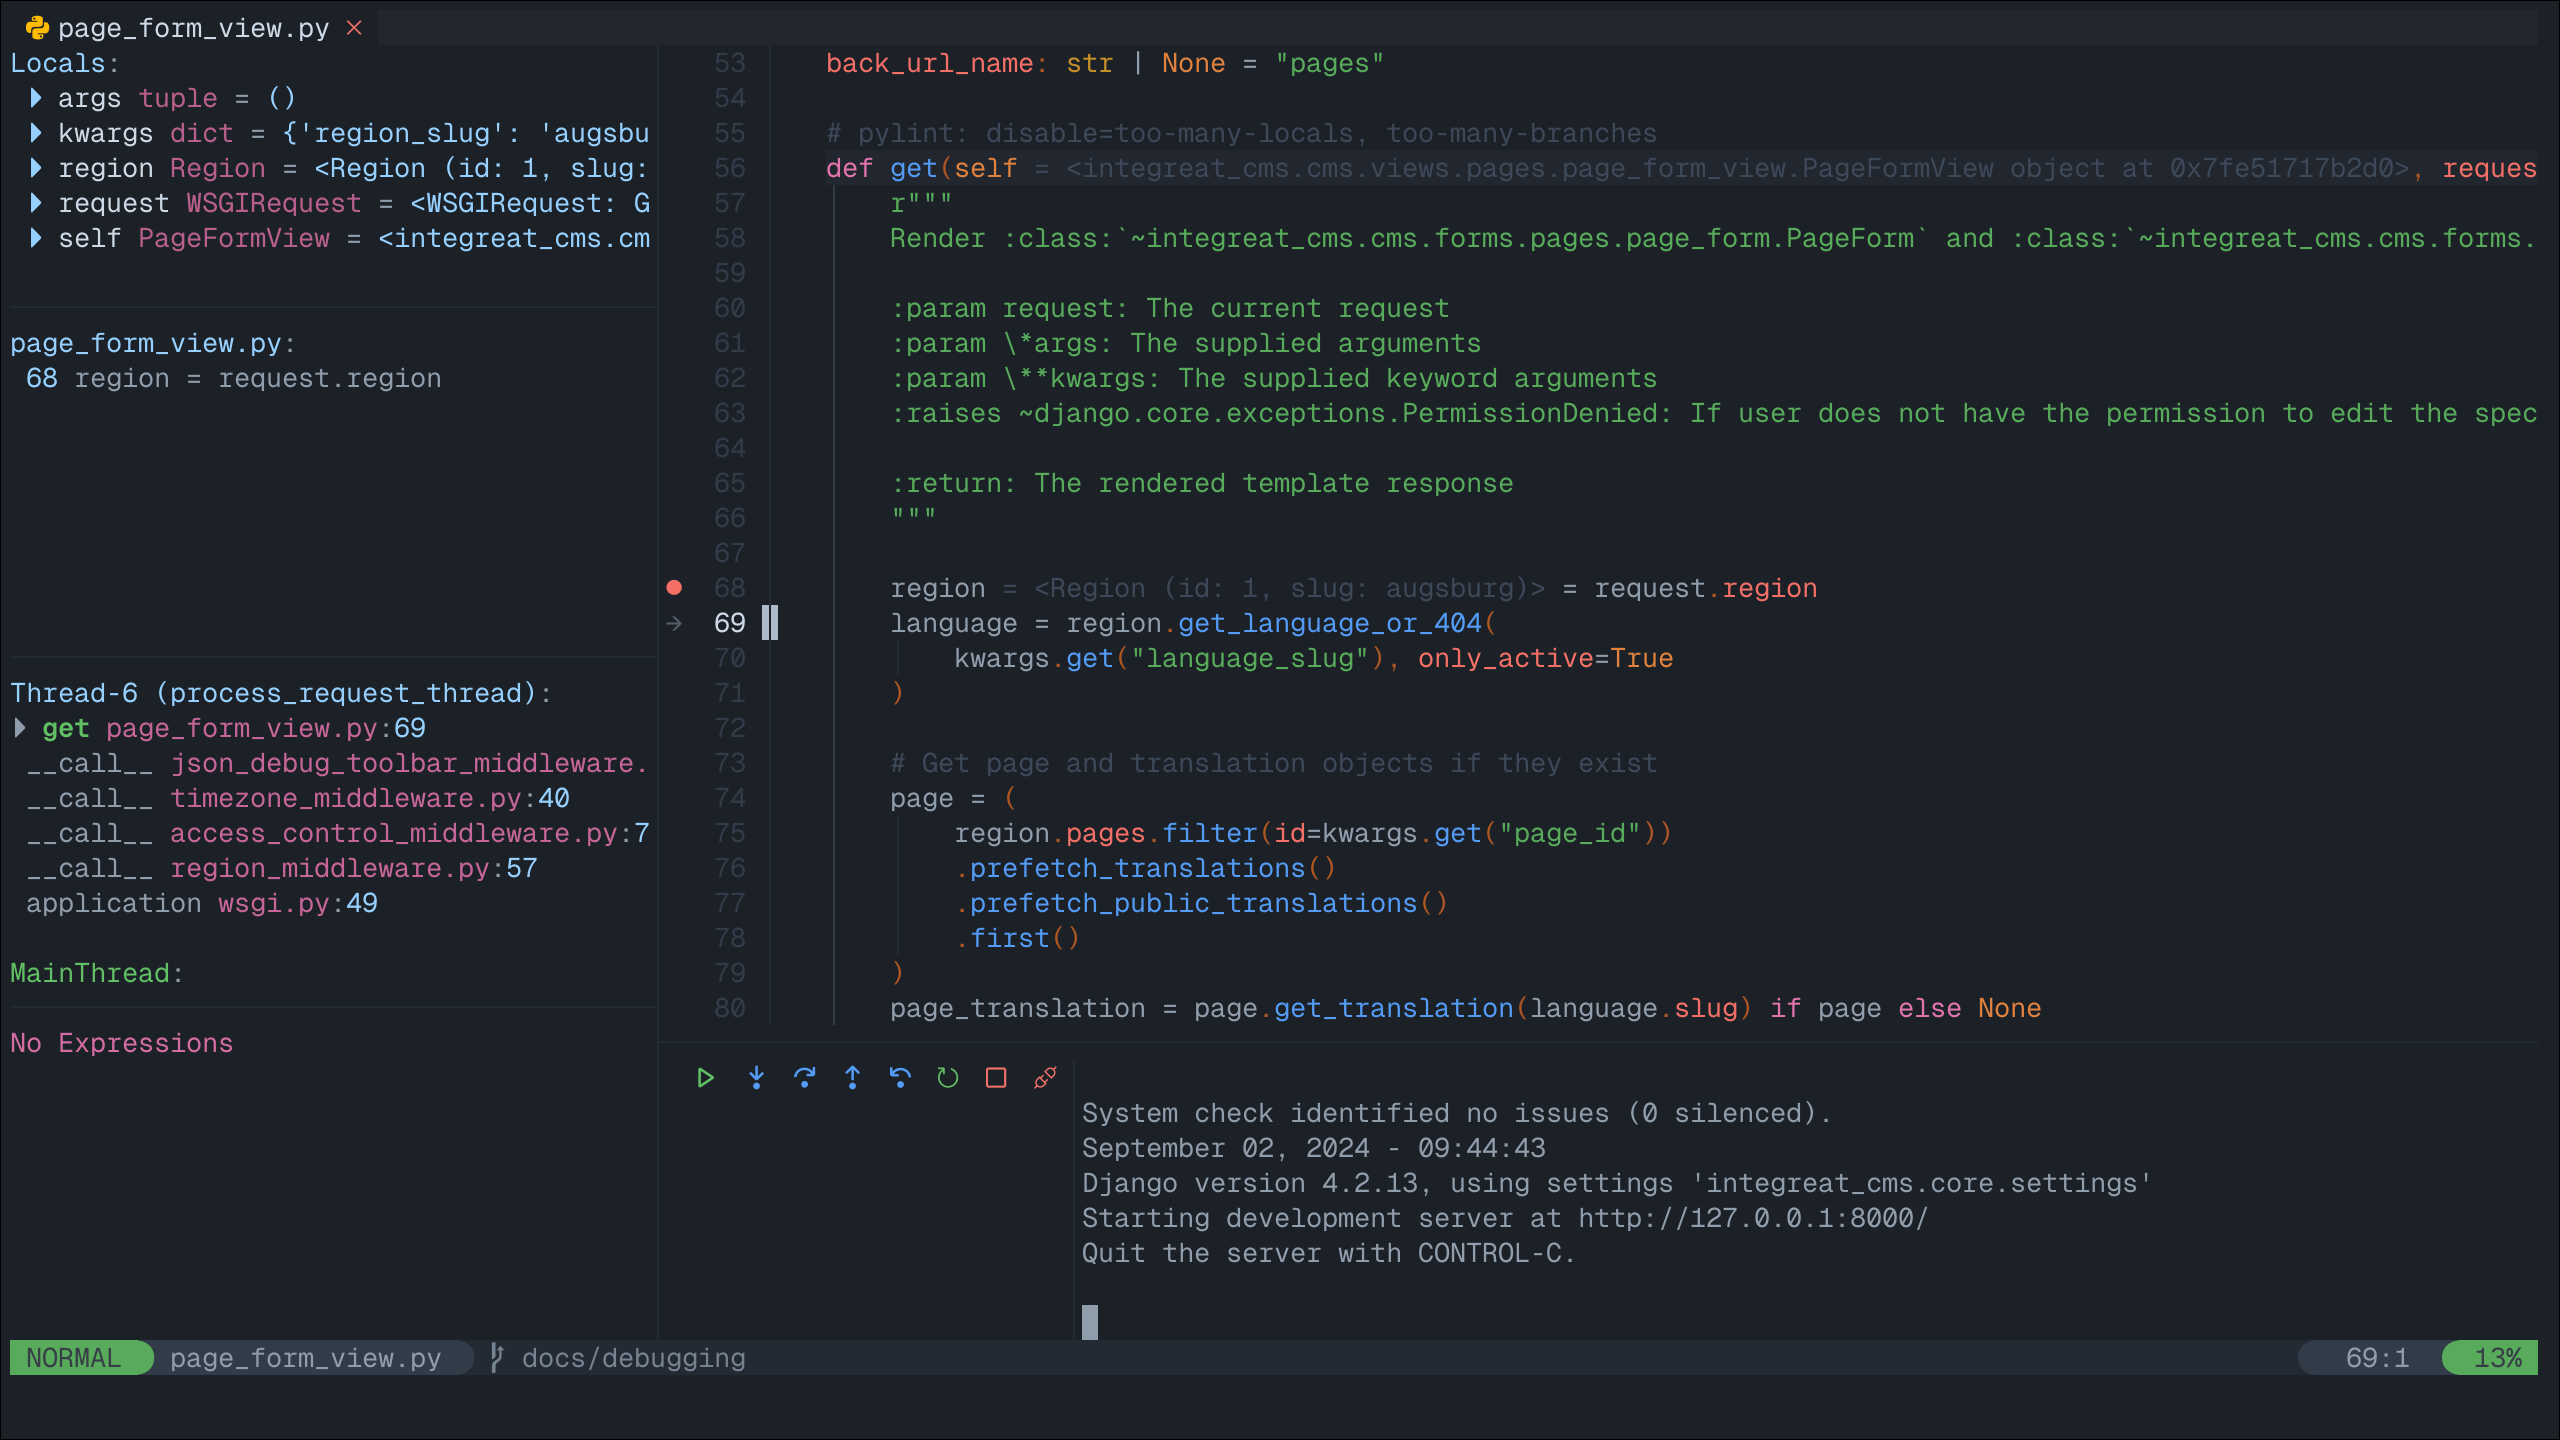
Continue pressing “step over” or try one of the other stepping mechanisms until you have found the information you are looking for. Note that the debugging process will never stop if you simply keep clicking “step over”, even after you have reached and moved past the
returnstatement at the bottom of thegetmethod.If you want to end the debugging process, click the “play” button to let the CMS run normally again. Your debugging breakpoint will still exist, so repeating the attempt to load a page form view will put you right back into the debugging process.
Nixvim
If you are a user of the nixvim project (there’s dozens of us! Dozens!!), include the following snippet somewhere inside your nix config. This will result in a debugging config equivalent to the one described above for neovim. Usage is identical.
programs.nixvim.plugins.dap = {
  enable = true;
  extensions = {
    dap-python.enable = true;
    dap-ui.enable = true;
    dap-virtual-text.enable = true;
  };
};

programs.nixvim.plugins.dap.configurations.python = [{
  name = "Launch Django DAP";
  type = "python";
  request = "launch";
  program = { __raw = /* lua */ '' vim.loop.cwd() .. "/.venv/bin/django-admin" ''; };
  args = [ "runserver" "--noreload" ];
  justMyCode = true;
  django = true;
  console = "integratedTerminal";
  env = {
    "DJANGO_SETTINGS_MODULE" = "integreat_cms.core.settings";
    "INTEGREAT_CMS_DEBUG" = "true";
    "INTEGREAT_CMS_SECRET_KEY" = "dummy";
  };
}];

programs.nixvim.keymaps = [
  { mode = "n"; key = "<leader>dB"; action = "<cmd>lua require('dap').set_breakpoint(vim.fn.input('Breakpoint condition: '))<cr>"; options = { silent = true; desc = "Breakpoint Condition"; }; }
  { mode = "n"; key = "<leader>db"; action = "<cmd>DapToggleBreakpoint<cr>"; options = { silent = true; desc = "Toggle Breakpoint"; }; }
  { mode = "n"; key = "<leader>dr"; action = "<cmd>DapContinue<cr>"; options = { silent = true; desc = "Start or Continue"; }; }
  { mode = "n"; key = "<leader>du"; action = "<cmd>lua require('dapui').toggle()<cr>"; options = { silent = true; desc = "Dap UI"; }; }
];
In case you are using the project’s flake.nix to configure your environment, feel free to omit the env part of the DAP configuration.